Having Fun Plotting Data Squirrels in R

A 5 min leisure coding session can do wonders for data scientists
Authorities in New York spent some of their time and a lot public money in collecting data about squirrels. This dataset is called the NYC Squirrel Census data.
 rfordatascience
Dataset
The dataset contains information about individual squirrels. Some of the columns are
- Age category
- Squirrel ID
- Activities it does
- Sounds it makes
- Skin Color
Accessing the data
data_url <- 'https://raw.githubusercontent.com/rfordatascience/tidytuesday/master/data/2019/2019-10-29/nyc_squirrels.csv'

d_raw <- read_csv(data_url)
head(d_raw)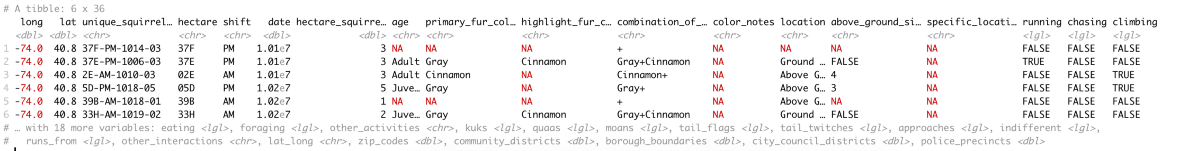
Cleaning and filtering
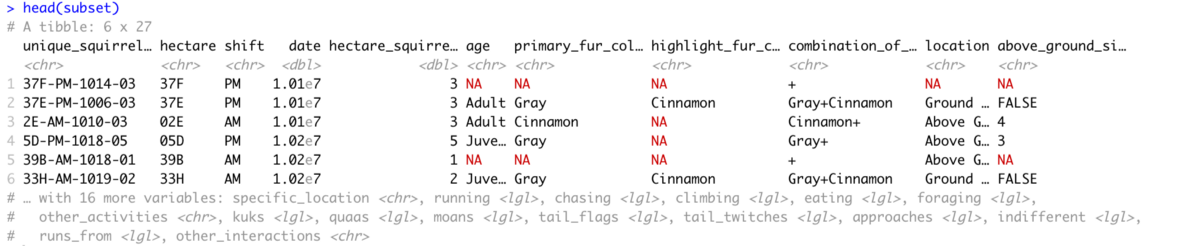
Let’s remove some of the columns and analyse the rest of it.
%>% is the pipe symbol and is described in detail here
Plotting
Now let’s fetch some information for plotting.
d_activity <- data %>%
# select only identifiers and activities column
select(c(identifiers, activities)) %>%
select(-c(other_activities)) %>%
pivot_longer(-identifiers, names_to = 'Activity', values_to = 'Value') %>%
# remove all rows with false value
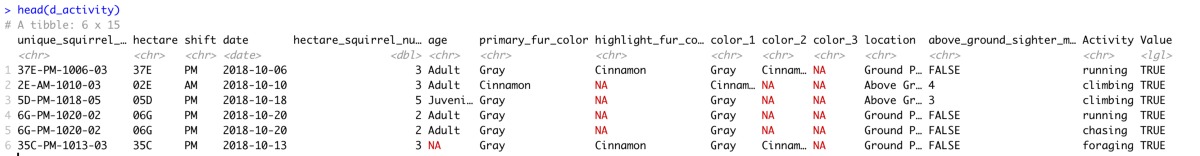
filter(Value == T)This new dataframe looks cleaner.
Activities By Time
Let’s see how the squirrels spend their time during the day and during the evening.
p <- ggplot(data = d_activity, aes(x=Activity, fill=shift)) +
  geom_bar(position = 'dodge')
print(p)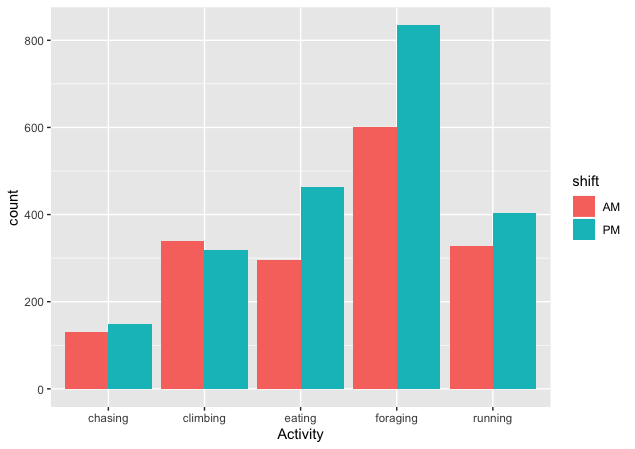
We can clearly see that there’s a greater deal of foraging and eating in the evening as compared to other activities which are more equally spread out over the day.
Categorising by Age
Let’s see how the squirrels are distributed by age.
p<- ggplot(data = data, aes(x=age, fill=age)) +
    geom_bar(width=1)
print(p)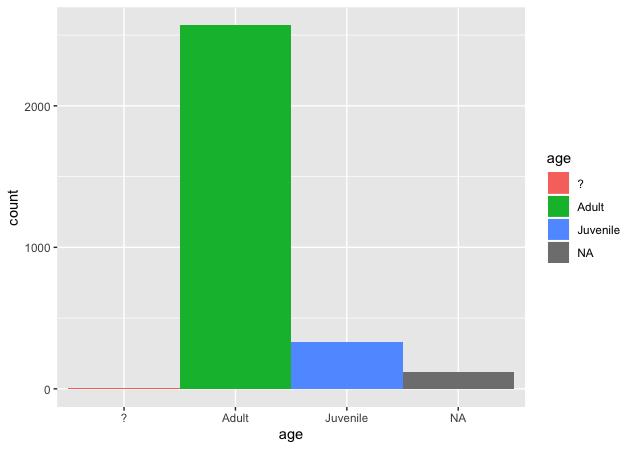
We can see that there are some entries that are NA and some that are labelled as a question-mark.
Sounds Analysis
Let’s analyse the sounds that these cute little jumpy creatures make. Note the use of pivoting (pivot_longer) in the code below. Pivoting is explained in detail here.
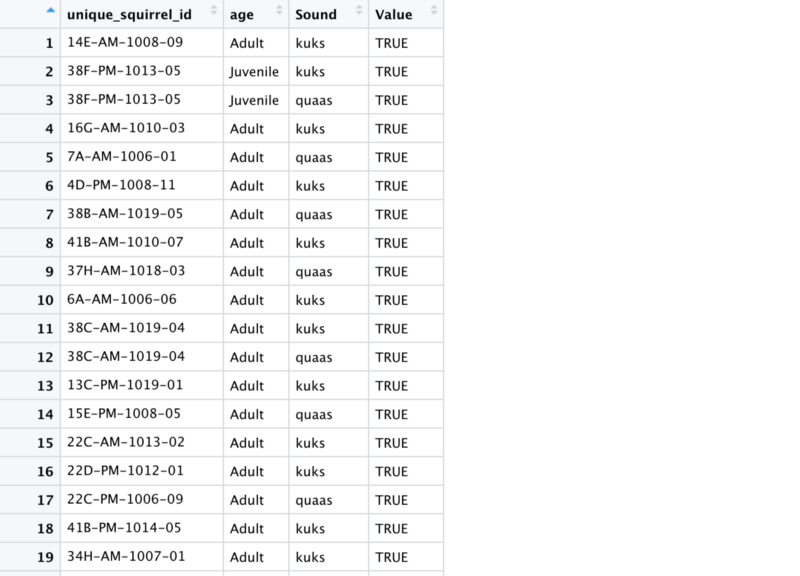
# Analysis for the squirrel sounds and human interractions
sound_activity <- data %>%
  select(c(unique_squirrel_id, age,sounds)) %>%
  pivot_longer(-c(unique_squirrel_id, age), names_to = 'Sound',
    values_to = 'Value') %>%
  drop_na(age) %>%
  filter(Value== TRUE)
The resulting dataframe looks like this
Let’s plot it and see for ourselves.
p <- ggplot(sound_activity, aes(x = age, fill= Sound)) +
     geom_bar(stat = "count")
print(p)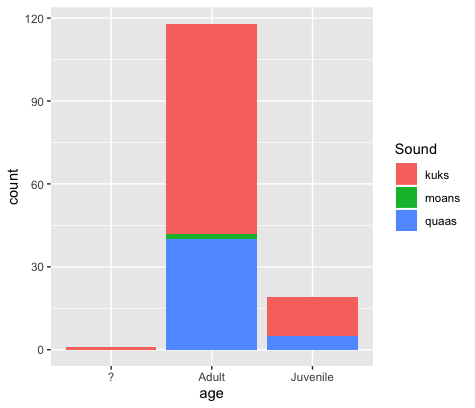
We can see that a huge number of adult squirrels make the kuks noise. However, in the raw data the total number of adult squirrels is much higher than the juvenile ones. This data does not show a fair comparison of the percentage of adults making these sounds.
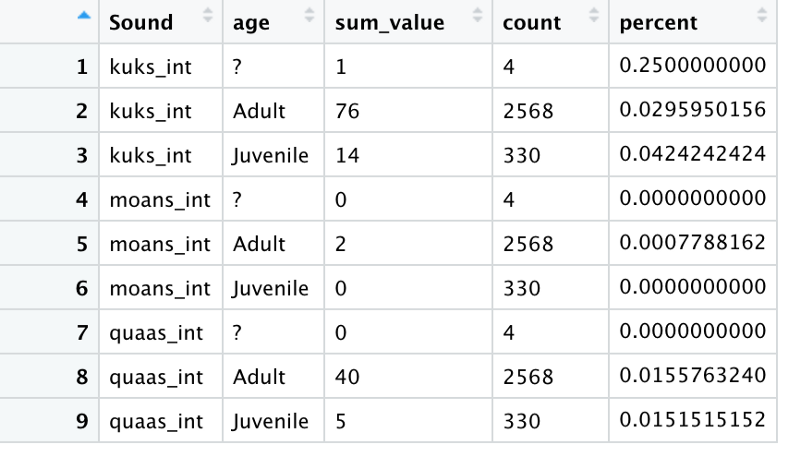
When plotted this looks like the following
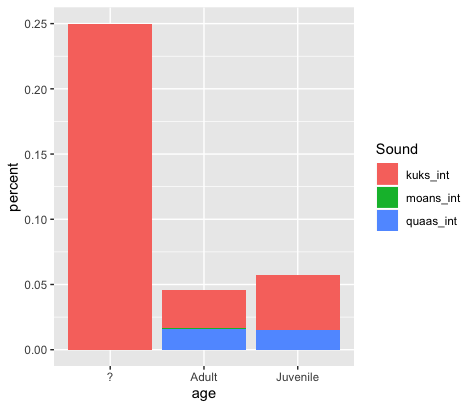
Note that a higher percentage of juvenile squirrels make the kuks sound. Whereas, the quaas sound is similar across age categories. Because, the quaas sound indicates the presence of a predator we can say that squirrels remain afraid of predators even as they age.
Sounds by time
Let’s see how the sounds are distributed across time.
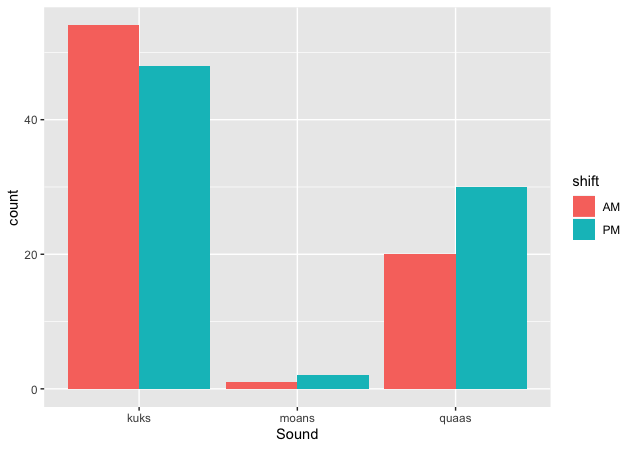
We can see that kuks dominate the total number of sounds. Even so the quaas and moans happen closer to the evening indicating a shift of mood from playful to scared.
Location with time
Let’s see how squirrels move with respect to time
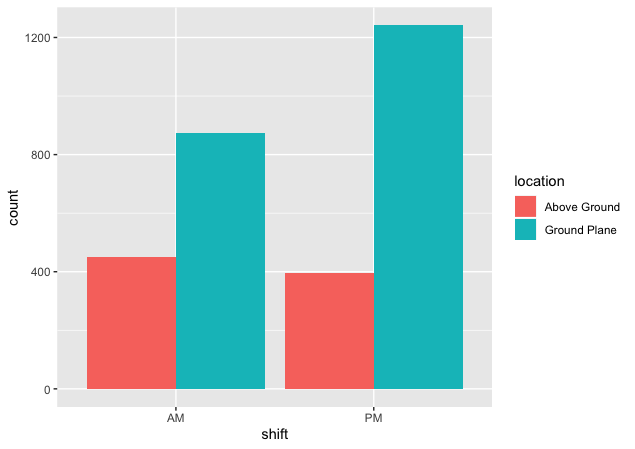
We see that more squirrels come down to the ground as evening approaches. This could be because of a greater amount of food or lesser number of humans to disturb them.
Location with age
Let’s also take a look at how location changes with age.
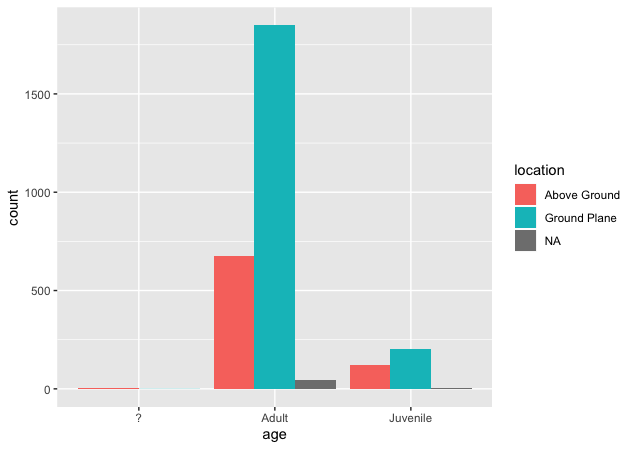
We see that a higher percentage of adults stay on the ground. This seems intuitive as they are more fearless.
The last interesting analysis could be to see the interactions between humans and the squirrels.
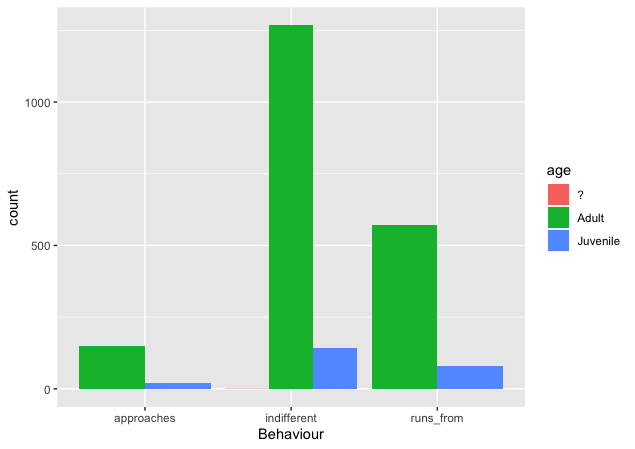
Human Squirrel Interaction
In absolute numbers elder squirrels are indifferent to a large extent to humans. The chart below does not provide a relative picture.
Let’s see the behaviour of squirrels when normalized by their overall counts.
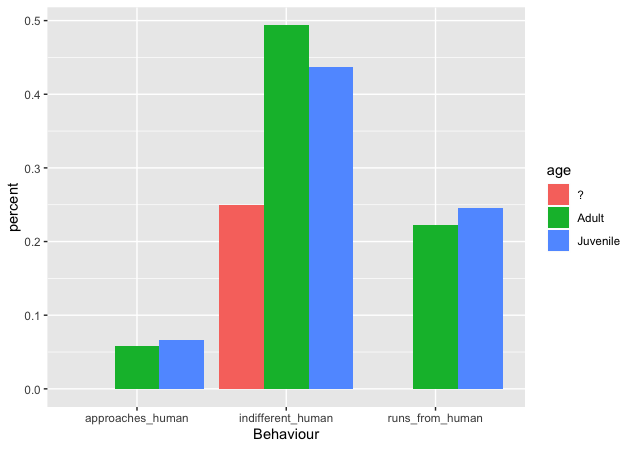
We can see that elder squirrels are actually more indifferent to humans, but those which tend to approach humans are lesser in percentage as compared to the juvenile ones.
Thanks to Rahul and Satyaprakash Pareek for helping with the analysis. For more fun assignments in R, do follow this Github repo made by Rahul Nayak.
R makes data analysis fun. It is a must-know tool for any beginner data scientist.
Member discussion