Understanding Indian Premier League with Data Science

Quantifying success, efficiency and performance in the richest league of cricket
Indian Premier League, or IPL, is a cricket league that began in 2008. In more than a decade it has transformed the landscape of cricket not only in India but across the world. This transformation has been achieved by immense amount of money that has been pumped into cricket especially by IPL teams during player auctions.
IPL is now the most-attended cricket league in the world and has a brand value of ₹475 billion (US$6.7 billion). According to some reports, IPL contributed approximately US$200 million to the GDP of the Indian economy. With the staggering amount of money available, IPL promises a chance for young Indian cricketers fighting for limited playing positions available in international cricket to become financially stable for the rest of their lives. Players are purchased at an annual auction (which has some complex mechanisms such as player retention, not needed for our analysis here) by one of the IPL teams (currently 8 active).
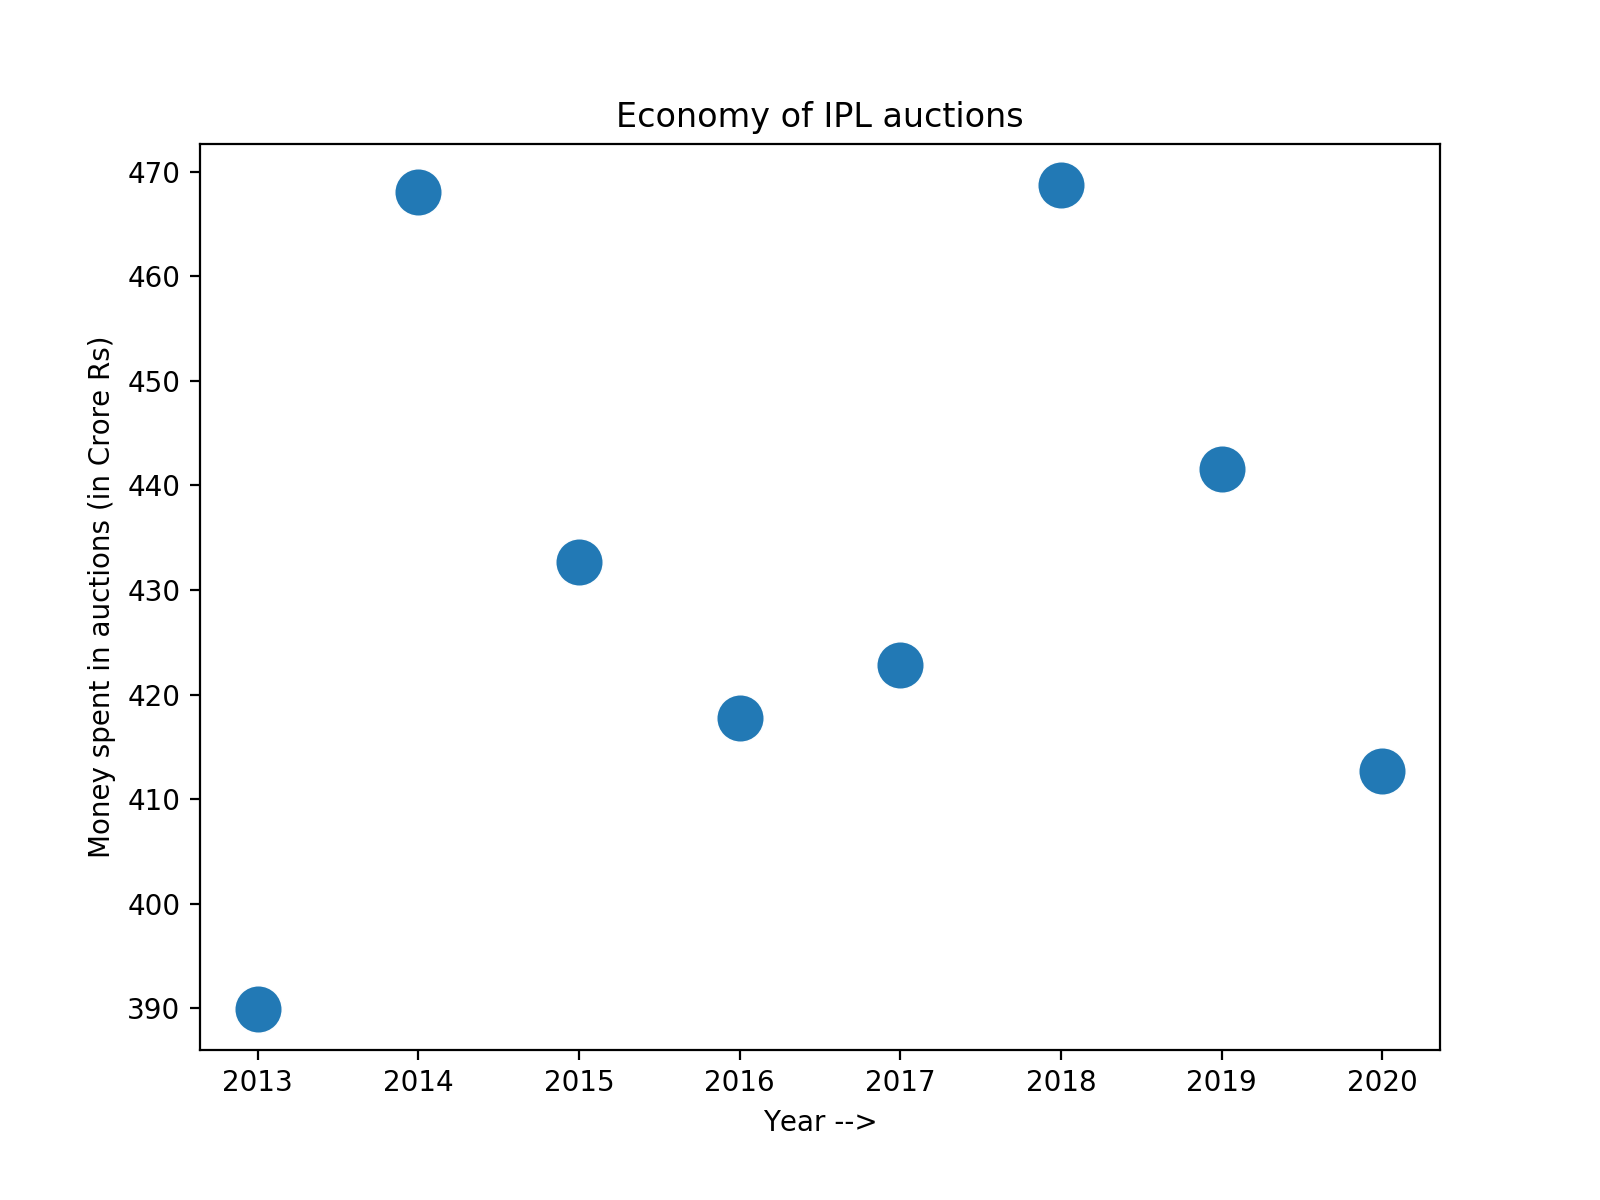
The latest auction (2020) totalled ~400 crore Indian rupees (INR), equivalent to ~57 million US$. Interestingly, there seems to be some sort of cyclical way in which the money expenditure occurs. Teams seem to invest a lot of money for one year and then wait for its results to come to fruition as indicated by large expenditure incurred in 2014 and 2018.
And yet, despite the plethora of cricketing talent and vast troves of money available, teams have not had equal success in the IPL.
Here, we seek to address the relationship between money spent at auctions and success in the league in order to understand the most efficient spenders in the IPL.
Background tidbits
There have been several changes through the years to the auction process, as well as the league structure itself. Teams have been added, removed and have changed names. Additionally, some teams were also banned for a few seasons while others changed their names.
In each season of IPL, teams play each other in a round-robin style competition. Each win gives a team 2 points, a loss 0 and all other results (tie, match rained out etc) 1 point. At the end of these ‘group-stages’ team enter a knock-out style tournament. For our analysis, we ignore these ‘knock-out’ stages and instead focus on the ‘group-stages’ with the idea that ‘group-stages’ are a better representative of the solidity of the team and its ability to perform repeatedly.
Quantifying performance and success
Lets analyse team performance in the Indian Premier League.
1. Does money guarantee success?
Not necessarily. To assess this question, we define success to the total points a team earned through seasons 2013 to 2019.
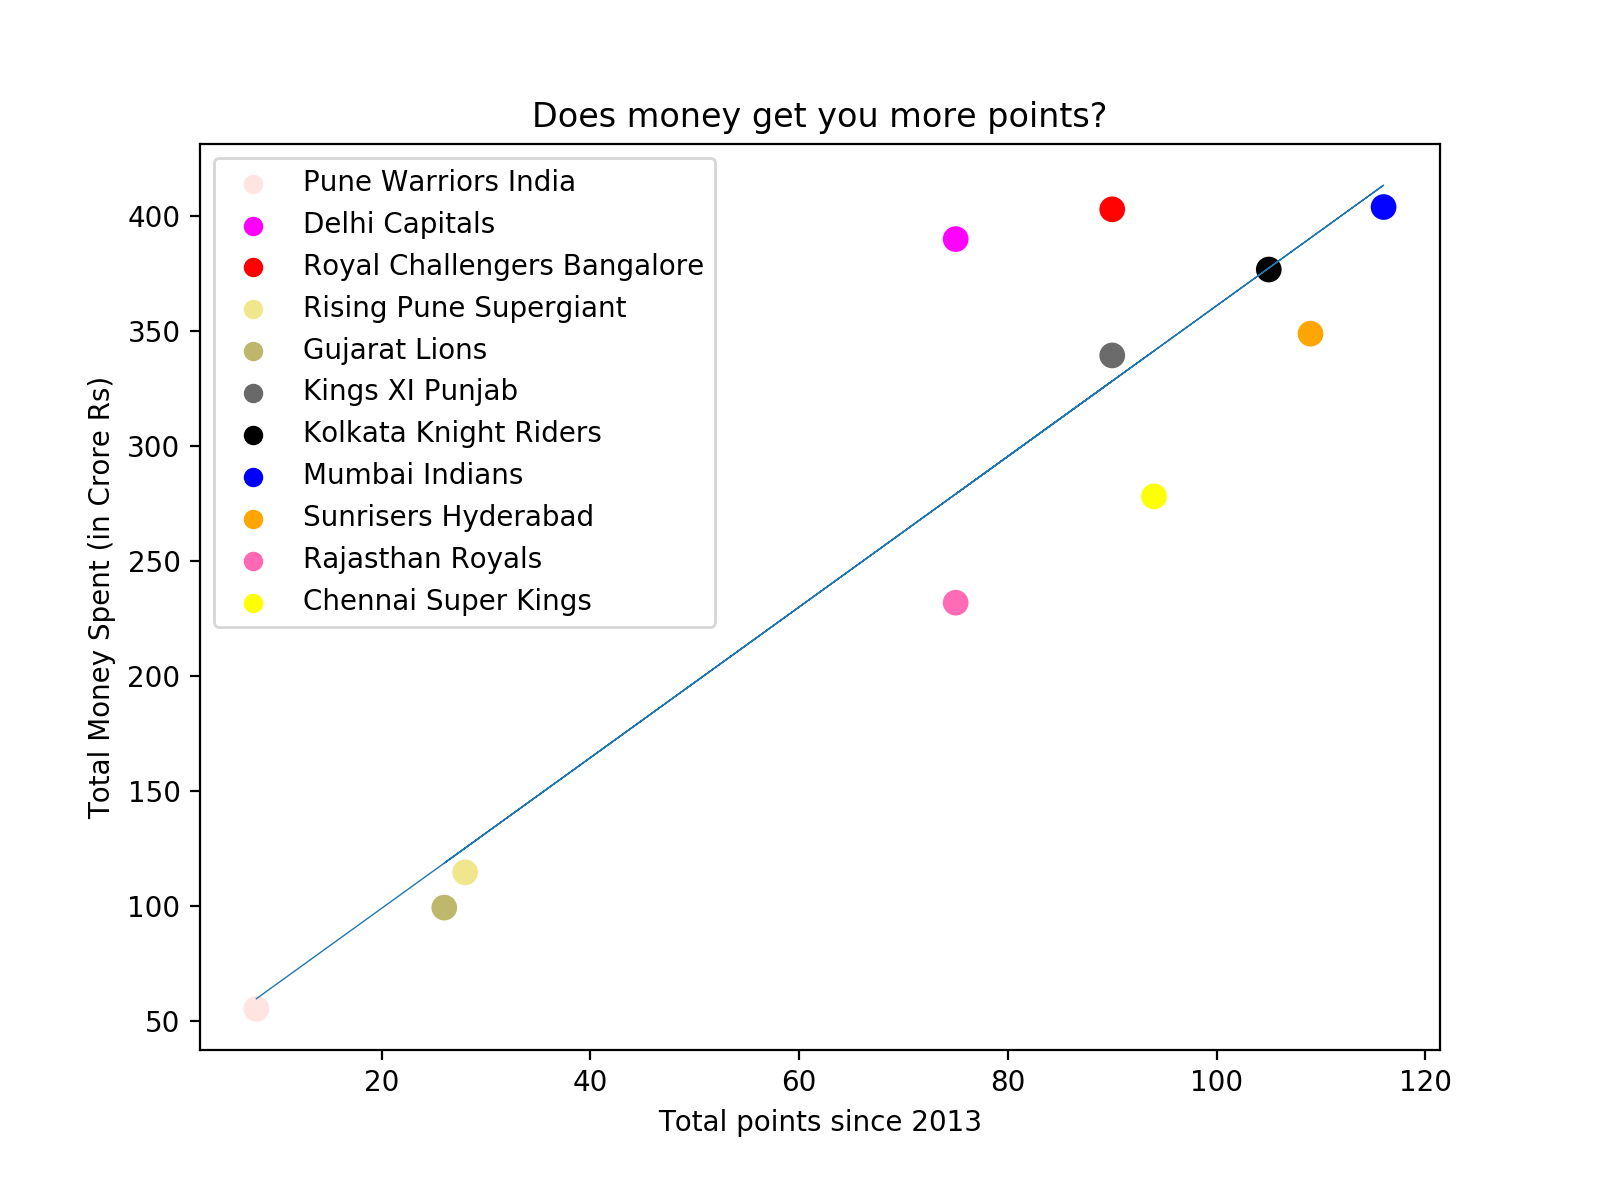
Turns out that while spending more will get you more points it is certainly not the norm. This is proven by the deviation from the regression line and the teams above the line are getting less worth for their buck. They spend a lot more than their peers without seeing equivalent return in terms of points.
Teams like Chennai Super Kings, Rajasthan Royals and Sunrisers Hyderabad seem exceptionally better in getting their money’s worth.
2. Who knows what to buy?
Lets look at a metric to explicitly assess the efficiency of expenditure, crore rupees spent per point since 2013. The lower this metric, the better a team is at converting its money to real world success in the IPL. We plot this metric across different teams, with the size of the scatter point proportional to the total points earned. The higher a team is on the y-axis, the more wasteful they have been with their money.

This visualization clearly answers the question of the most efficient spenders in IPL (CSK, RR, SRH). Delhi and RCB are the most inefficient among the big point earners. Note that the low point earners (small sized circles) are either new teams or old disbanded teams.
3. Do teams consistently perform to their ‘potential’? Is their ‘potential’ good enough?
Often times, we hear commentators refer to the potential of a team. This is another subjective term that we can quantify using data in the following analysis. Furthermore, consistency of performance is an important metric for any sports team.
To understand both these concepts, we evaluated the deviation of every teams efficiency (or inverse of it, i.e. points per crore rupees) from their respective mean across seasons. This ‘mean performance’ of team allows us to quantify their ‘potential’. Thus, by focusing only on each team’s performance, this analysis focuses solely on the consistency of a team compared to themselves and does not care about the performance of their competitors.
We chose three representative teams (MI, KKR and RCB) which have played all seasons of the IPL for the sake of consistency. The numbers next to the plot show the teams eventual ranking in the league tables.
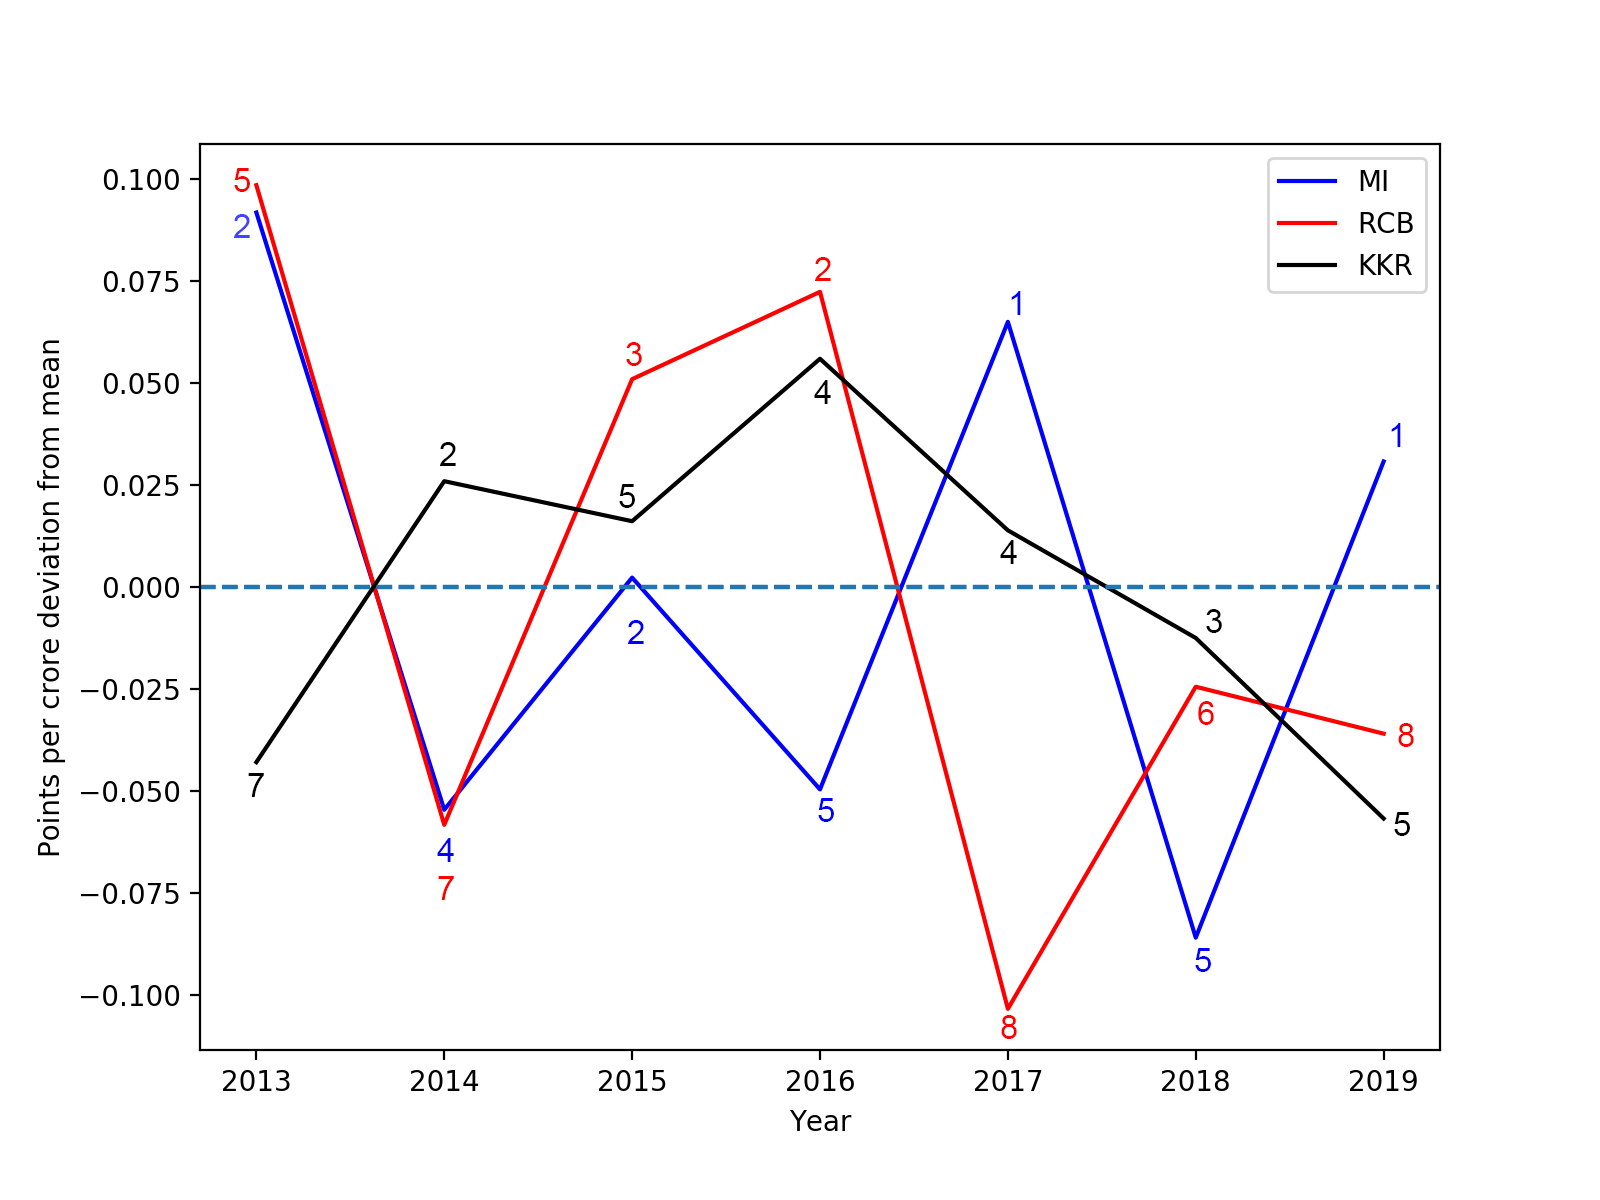
For a successful team (in terms of points earned across seasons)like MI, the data shows whenver they meet or exceed their ‘potential’ they are in top 2! This means their ‘potential’ is high enough to succeed in a competitive league. However, they seem to oscillate between seasons of exceeding the potential and performing below the potential. (Recommendation: Find consistent performers even if it comes at cost of losing a little bit of ‘potential’)
On the flipside, for a less successful team like RCB, they have to exceed their potential by a lot to get to the top of the charts. Most of the times, they languish even below this potential highlighting their inconsistency. (Recommendation: Need a lot of work in both ‘potential’ and consistency)
Somewhere in the middle likes KKR. They are largely consistent performers punching above their weight consistently without finishing in the absolute top 2, highlighting the need to work on increasing their ‘potential’. (Recommendation: A little focus on increasing ‘potential’ can put them in the top of the league)
Conclusion
IPL teams go through changes of fortune, and throwing money blindly is not the answer to their problems. We defined two possible axes for teams to focus on, ‘potential’ and consistency. How these connect to real cricketing players will require an in-depth exploration of player statistics. This analysis will also be critical in building a ‘Moneyball for Indian Premier League’ framework.
If you liked the analysis, consider subscribing to the AI Graduate. Their high-quality one article per week is a great way to learn how to do build your data science expertise.
Other Details
There are a few quirks in the data that we found during this project and a few assumptions that we made. If you are interested in improving upon this project please shoot an email, or have a look into the code repository.
 ABMalhotra
1. We performed the analysis for IPL seasons 2013 onwards because auction data was only available for these seasons.
2. Teams that existed before this cutoff 2013 season (e.g. Kochi Tuskers) are therefore not featured in our analysis.
3. Pune has two teams in the analysis: Warriors and Supergiants. Wehave not been following IPL for a long time now, so we did not realize both were Pune teams. Both the names appear in the analysis.
4. Delhi team recently changed its name from Daredevils to ‘Capitals’. (A very weird name change if you ask us. Mumbai ‘Indians’ will like to have a word.) All their results appear under their new name.
5. The auction data for 2013 season was in US$. It has been converted to ₹ to be consistent with other data using an approximate 2013 exchange rate of 61₹ to 1US$.
6. The IPL website lists only the amount of money ‘left’ in the purse. To obtain the money spent we subtracted it from 60 crore INR (this was the purse available to each team for the season. Not sure if this has been always the case though.)
6. Time value of money and/or Monetary inflation effects are not accounted for in our analysis. Thus, all expenditure data reflects the year that expense occurred in and has not been adjusted for today’s value.
Member discussion