Computing Histograms Using Java Arrays
Histograms give a clear idea of how your data is distributed.
Histograms are used to organise data into different buckets. For example you may want to visualise the age range of Ph.D. students in a university. You can make buckets of ages 20–25, 26–30, 30–35 and so on. If you count the number of students in each bucket or bin you have a histogram.
Say you were to group children based on their SAT scores. First you plot all SAT scores on a line and divide that line into fragments of 400

Collect all these scores in each fragment/bucket/bin and plot it as a bar plot and add a scale to the plot
Today we will see that given an array of numbers how do we compute its histogram array in Java.
The complete github code is in the following gist
We will use 2 different ways to compute a histogram. One of them is much slower compared to the other. We primarily work with 2 arrays
- The input array — This is the array containing the grade scored by each student and called student_grades
- The output array — This is the histogram array which tells us how many students scored which grade and is called grade_histogram
We initiate the arrays in the following manner
//Generate a random array of student grades
int[] student_grades   =
random.ints(NUM_STUDENTS, 0,HIGHEST_GRADE).toArray();

//Generate an empty histogram array. Each element represent how many students scored that grade
  int[] grade_histogram   = new int[HIGHEST_GRADE];
  int[] grade_histogram_fast  = new int[HIGHEST_GRADE];
Slower Method
//Function to compute histogram O(N^2)
public void getHistSlow(int iArr[], int oArr[])
{
int i,j;
for(i=0;i<HIGHEST_GRADE;i++)
{
int count=0;
for(j=0;j<iArr.length;j++)
{
if(iArr[j]==i)
{
count++;
}
}
oArr[i]=count;
}
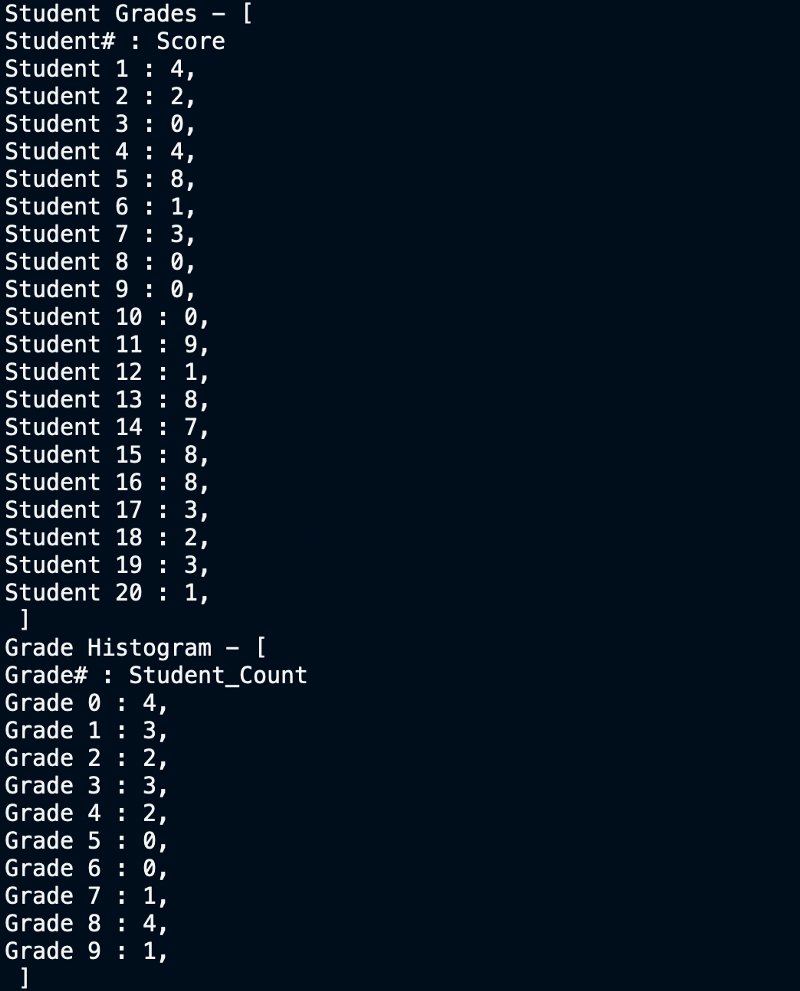
}In this we go over each element of our student grades array and check how many other elements does this element match. Then we create the histogram based on how many matches does each grade get. In the example below grade 2 was scored by Student 1, 3 and 4. Thus, Grade 2 gets 3 matches and its corresponding histogram bin reflects 3.
- The element we are comparing with all other elements lies at index i
- The element being compared to i lies at index j
We can see that it is a wasteful approach because we check for grade 2 many times. This over-and-over-again scanning makes the program run in O(N²). We don’t need to keep scanning this array over and over again.
Let’s look at the O(N) approach.
Faster Method
//Function to compute histogram faster O(N)
 public void getHistFast(int iArr[], int oArr[])
 {
  int i;
  for(i=0;i<iArr.length;i++)
  {
   oArr[iArr[i]] = oArr[iArr[i]] + 1;
  }
 }
In this method we go to each student in the student grade array and see its grade. We go to the corresponding grade histogram element and update the grade count.
Analysis
When we take an array of 20 students having scored grades between 0–9, we get the following output
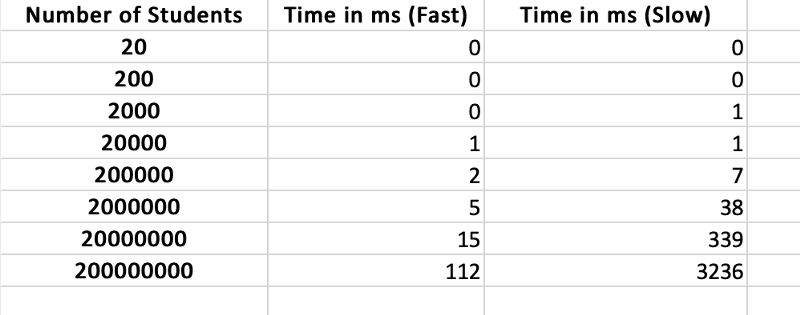
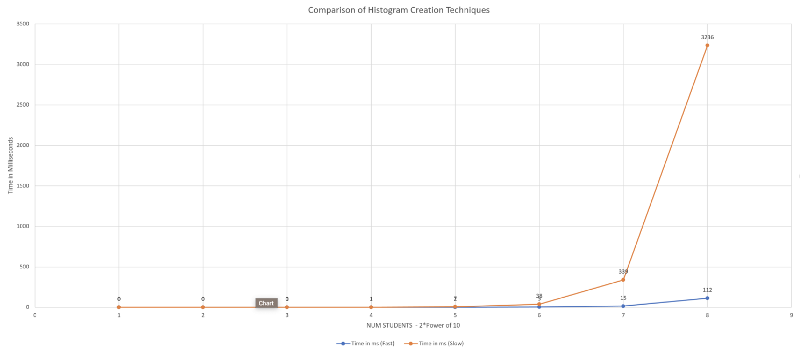
Speed Test
We compare both the fast and the slow methods on time by increasing the number of students. Although we can’t see the O(N²) behaviour of the slower method it is definitely many times slower than the fast method.
Member discussion