Python Tools for a Beginner Data Scientist

Using these libraries makes a data scientist’s life very easy
Python has tools for all stages of the life cycle of a data science project. Any data science project has the following 3 stages inherently included in it.
- Data Collection
- Data Modelling
- Data Visualization
Python provides very neat tools for all 3 of these stages.
Data Collection
1) Beautiful Soup

When data collection involves scraping data off of the web, python provides a library called beautifulsoup.
from bs4 import BeautifulSoup
soup = BeautifulSoup(html_doc, 'html.parser')
This library parses a web page and stores its contents neatly. For example, it will store the title separately. It will also store all the <a> tags separately which will provide you with very neat list of URLs contained within the page.
As an example let us look at a simple web page for the story of Alice’s Adventure in Wonderland.

Clearly we can see a few html elements there which we can scrape.
- Heading — The Dormouse’s story
- Page text
- Hyperlinks — Elsie, Lacie and Tillie.
Soup makes it easy to extract this information
soup.title
# <title>The Dormouse's story</title>

soup.title.string
# u'The Dormouse's story'

soup.p
# <p class="title"><b>The Dormouse's story</b></p>

for link in soup.find_all('a'):
    print(link.get('href'))
# http://example.com/elsie
# http://example.com/lacie
# http://example.com/tillie

print(soup.get_text())
# The Dormouse's story
#
# Once upon a time there were three little sisters; and their names were
# Elsie,
# Lacie and
# Tillie;
# and they lived at the bottom of a well.
#
# ...
For pulling data out of HTML and XML files this is an excellent tool. It provides idiomatic ways of navigating, searching, and modifying the parse tree. It commonly saves programmers hours or sometimes even days of work.
2) Wget
Downloading data , especially from the web, is one of the vital tasks of a data scientist. Wget is a free utility for non-interactive download of files from the Web. Since it is non-interactive, it can work in the background even if the user isn’t logged in. It supports HTTP, HTTPS, and FTP protocols, as well as retrieval through HTTP proxies. So the next time you want to download a website or all the images from a page, wget is there to assist you.
>>> import wget
>>> url = 'www.futurecrew.com/skaven/song_files/mp3/razorback.mp3'
>>> filename = wget.download(url)
100% [................................................] 3841532 / 3841532
>>> filename
'razorback.mp3'
3) Data APIs
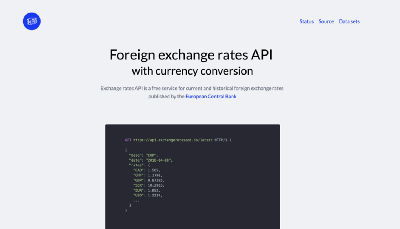
Apart from the tools that you need to scrape or download data, you also need actual data. This is where data APIs help. A number of APIs exist in python that let you download data for free e.g. Alpha Vantage provides real-time and historical data for global equities, forex and cryptocurrencies. They have data for upto 20 years.
Using alpha vantage APIs we can, for example extract data for bitcoin daily values and plot it
from alpha_vantage.cryptocurrencies import CryptoCurrencies
import matplotlib.pyplot as plt
cc = CryptoCurrencies(key='YOUR_API_KEY',output_format='pandas')
data, meta_data = cc.get_digital_currency_daily(symbol='BTC', market='USD')
data['1a. open (USD)'].plot()
plt.tight_layout()
plt.title('Alpha Vantage Example - daily value for bitcoin (BTC) in US Dollars')
plt.show()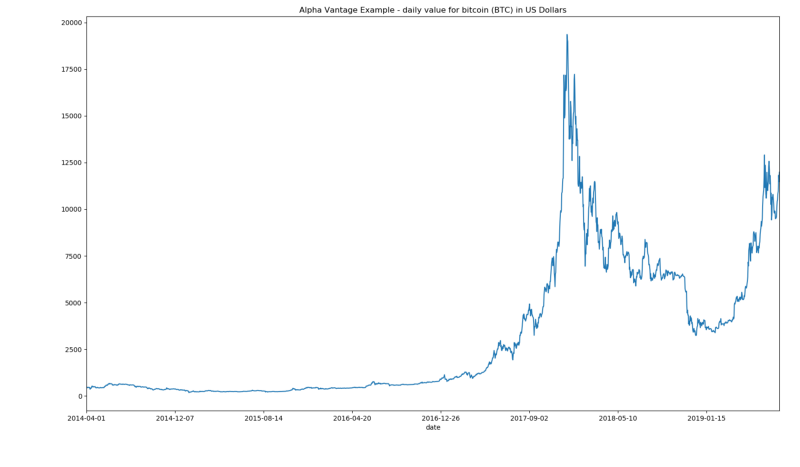
Other similar API examples are
Data Modelling
As mentioned in this article, data cleaning or balancing is an important step before data modelling.
1)Imbalanced-learn
Imabalanced-learn is one such tool to balance datasets. A dataset is imbalanced when one class or category of data has disproportionately larger samples than other categories. This can cause huge problems for classification algorithms which may end up being biased towards the class that has more data.
e.g. A command called Tomek-Links from this library helps balance the dataset.
from imblearn.under_sampling import TomekLinks
tl = TomekLinks(return_indices=True, ratio='majority')
X_tl, y_tl, id_tl = tl.fit_sample(X, y)
2) Scipy Ecosystem — NumPy
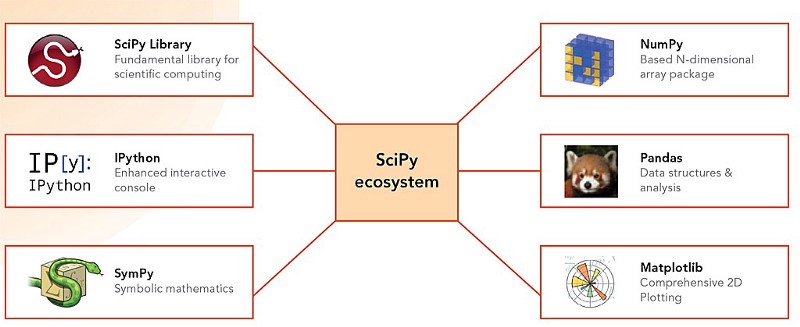
The actual data processing or modelling happens through python’s scipy stack. Python’s SciPy Stack is a collection of software specifically designed for scientific computing in Pytho. nScipy secosystem contains a lot of useful libraries but Numpy is arguably the most powerful tool among all.
The most fundamental package, around which the scientific computation stack is built, NumPy stands for Numerical Python. It provides an abundance of useful features for operations on matrices. If someone has used MATLAB they immediately realize that NumPy is not only as powerful as MATLAB but is also very similar in its operation.
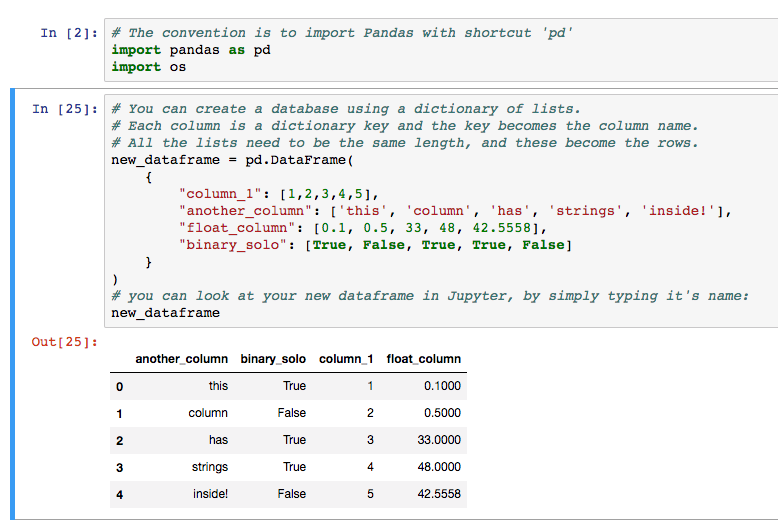
3) Pandas
Pandas is a library that provides data structures to handle and manipulate data. A 2-dimensional structure called dataframe is the most popular one.
Pandas is a perfect tool for data wrangling. It designed for quick and easy data manipulation, aggregation, and visualization.
Data Visualization
1) Matplotlib
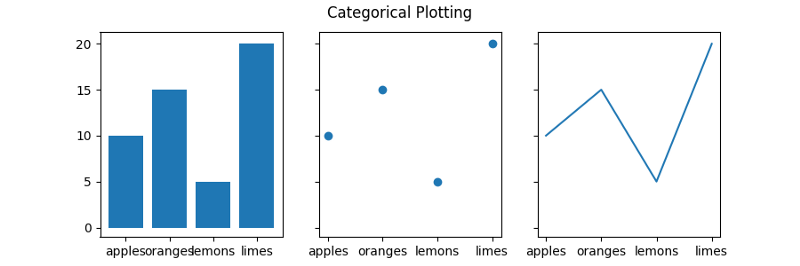
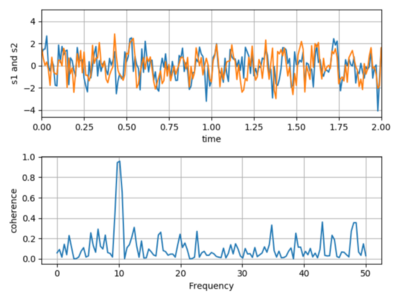
Another package from the SciPy ecosystem that is tailored for the generation of simple and powerful visualizations with ease is Matplotlib. It is a 2D plotting library which produces publication quality figures in a variety of hardcopy formats
Some examples of Matplotlib outputs
import numpy as np
import matplotlib.pyplot as plt

N = 5
menMeans = (20, 35, 30, 35, 27)
womenMeans = (25, 32, 34, 20, 25)
menStd = (2, 3, 4, 1, 2)
womenStd = (3, 5, 2, 3, 3)
ind = np.arange(N)    # the x locations for the groups
width = 0.35       # the width of the bars: can also be len(x) sequence

p1 = plt.bar(ind, menMeans, width, yerr=menStd)
p2 = plt.bar(ind, womenMeans, width,
             bottom=menMeans, yerr=womenStd)

plt.ylabel('Scores')
plt.title('Scores by group and gender')
plt.xticks(ind, ('G1', 'G2', 'G3', 'G4', 'G5'))
plt.yticks(np.arange(0, 81, 10))
plt.legend((p1[0], p2[0]), ('Men', 'Women'))

plt.show()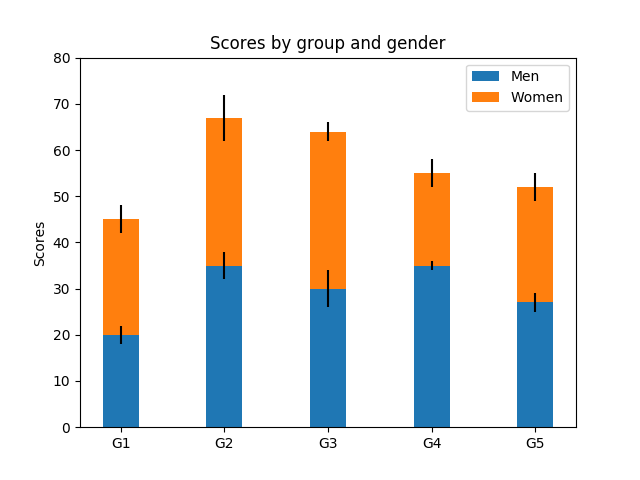
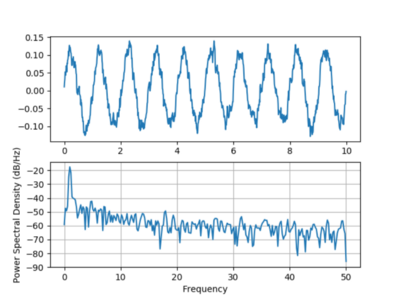
A few other examples
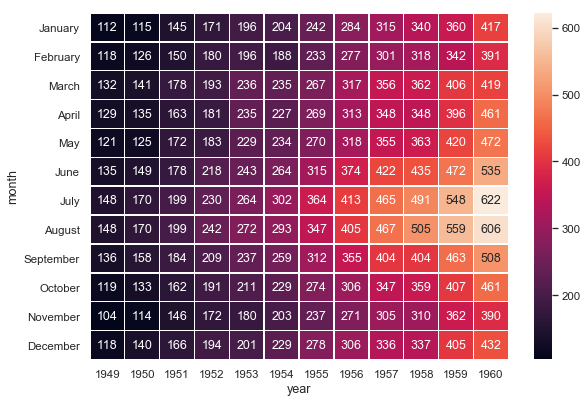
2) Seaborn
Seaborn is a Python data visualization library based on matplotlib. It primarily provides a high-level interface for drawing attractive and informative statistical graphics. It is mostly focused on visualizations such as heat maps
3) MoviePy
MoviePy is a Python library for video editing — cutting, concatenations, title insertions, video compositing, video processing, and creation of custom effects. It can read and write all common audio and video formats, including GIF.

Bonus NLP Tool — FuzzyWuzzy
This funny sounding tool is a very useful library when it comes to string matching. One can quickly implement operations like string comparison ratios, token ratios, etc.
>>> fuzz.ratio("this is a test", "this is a test!")
    97
>>> fuzz.partial_ratio("this is a test", "this is a test!")
    100
>>> fuzz.ratio("fuzzy wuzzy was a bear", "wuzzy fuzzy was a bear")
    91
>>> fuzz.token_sort_ratio("fuzzy wuzzy was a bear", "wuzzy fuzzy was a bear")
    100
Python has a huge wealth of information and tools to perform data science projects. It is never too late to explore!
Member discussion